Disclaimer: Opinions expressed below belong solely to the author
Not a week seems to pass by without reports of another million dollar HDB being offered somewhere in Singapore.
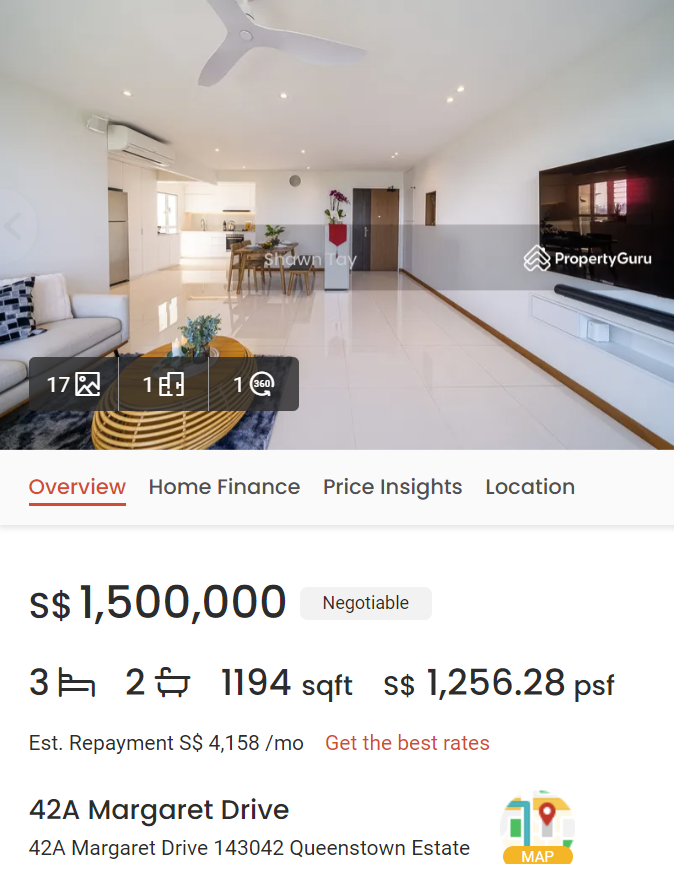
In fact, just a few days ago we could read about a swanky 5R, 1200 sqft. flat at Margaret Drive, with 97 years of lease left, listed at an eye-popping S$1.5 million.
However, stories like these do not provide an accurate image of the entire market.
First of all, not all of the homes can find a buyer at list price. The sheer fact that someone wants an X amount of money for something doesn’t mean someone else is going to pay it.
Secondly, large, relatively new, beautifully finished HDB flats are a tiny minority, not representative of entire Singapore.
They surely drive clicks to news portals but they may give a false impression as to what the resale situation actually is.
One chart to rule them all
How can we see the full picture, though? Here’s a list of conditions that need to be met:
- Instead of list prices we need to see actual transactions that took place, where money changed hands. This will show us how much people are really paying.
- These transactions have to be divided by apartment types or sizes and weighed in proportion to each other, so that we can get an accurate average.
- If possible, they should also consider other factors that affect prices, such as location, distance from MRT, tenure left and so on, so that outliers do not sway the average misleading us in the process.
- Finally, since prices change over time, we have to compare them against household income statistics, to understand whether resale apartments are getting more or less affordable in proportion to what Singaporeans can spend.
The first three conditions are actually met by the official HDB Resale Price Index.
It is based on actual, real transactions and reported quarterly against the base period of Q1 of 2009, which is equal to 100. So, if the index is 120 it means the flats are 20 per cent more expensive than in early 2009, if it falls to 80 it means the opposite.
Resale prices of HDBs can change quite a bit, not in a linear way. There was a bubble just ahead of the 1997 crisis, where they cost, on average, as much as they did 12 years later. There were also some periods of stability and calm in between, where they barely changed.
But what does that mean to an average Singaporean? Let’s add the missing ingredient: incomes.
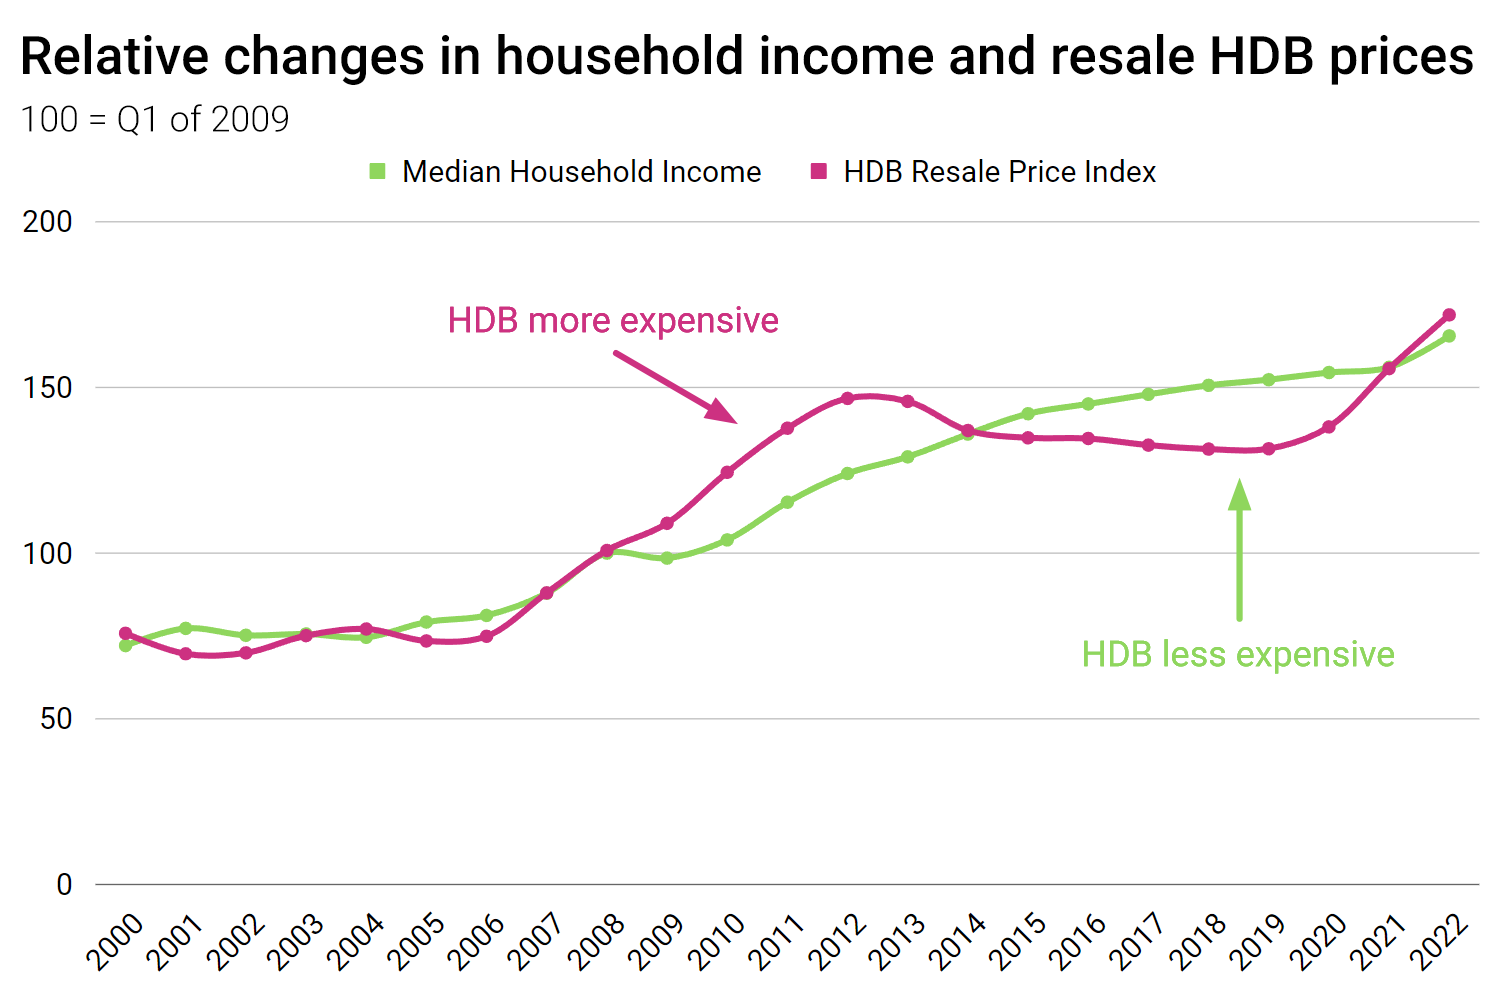
Based on employed household income data that can be found here I calculated a simple index of median income from work, with the value of 100 representing 2008 (as it is the closest to Q1 of 2009 that HDB RPI uses as its base).
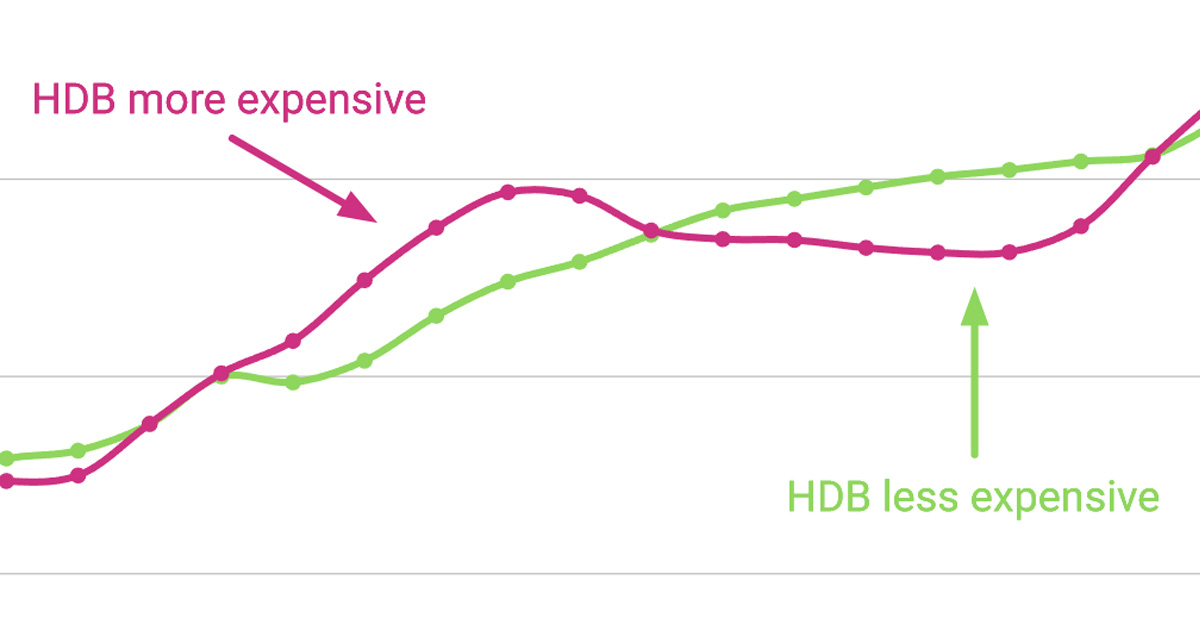
Whenever the red/purple line is above the green one, it means resale HDB prices are outpacing incomes — and when it falls below, the opposite happens.
The most expensive year this century? 2011
As you can see, after the financial crisis of 2008/09 incomes have seen a lower pace of growth, while resale HDBs leapt ahead.
Relative to incomes, the most expensive year was 2011, when the value of HDB index was 137.7 while salaries lagged behind at only 115.36. This means that incomes were growing at less than half the pace that apartment were appreciating at that time (or how much they should grow to match the historical parity).
However, by 2014 we could see a reversal. Flats started shedding value, while incomes rose steadily to surpass them.
Before the pandemic, which forced many people to stay and work from home, prices of resale flats had trailed incomes for six years, with the widest gap of ca. 21 per cent recorded in 2019.
Following COVID-19, however, the demand for homes surged, pushing prices up at the fastest pace in years.
That said, they only matched each other in 2021. In 2022 apartments were more expensive but by just 6 per cent.
In other words, it’s not that resale prices are abnormally high today but rather that they have been abnormally low since 2014 and have now only regained parity with incomes, surpassing them by a relatively small margin (so far).
Of course, when you’ve grown used to seeing much lower asking prices for several years, witnessing them rebound strongly in just a year or two is quite a shock.
But it’s likely that property appreciation slows down this year and incomes may close even this small gap that has now been opened (for the first time in about a decade).
Given that public housing is all about affordability — i.e. the ability to purchase it relative to what you earn — this big picture is all that matters in the end.