Disclaimer: Any opinions expressed below belong solely to the author.
It seems like there isn’t a day when a news story covering another million-dollar HDB transaction is making headlines in Singapore. The reality is, however, that these prices are reached in just 1 to 2 per cent of all HDB transactions each year.
These are usually the largest apartments, located in highly desirable buildings and neighbourhoods.
However, stories about these expensive apartments are enough to skew the public perception of housing affordability today and in the future.
While the government has tried to explain it, providing figures to prove its case, many people still distrust it. So, how about we introduce a 3rd party, one which regularly reviews housing prices across the entire Asia-Pacific? Urban Land Institute.
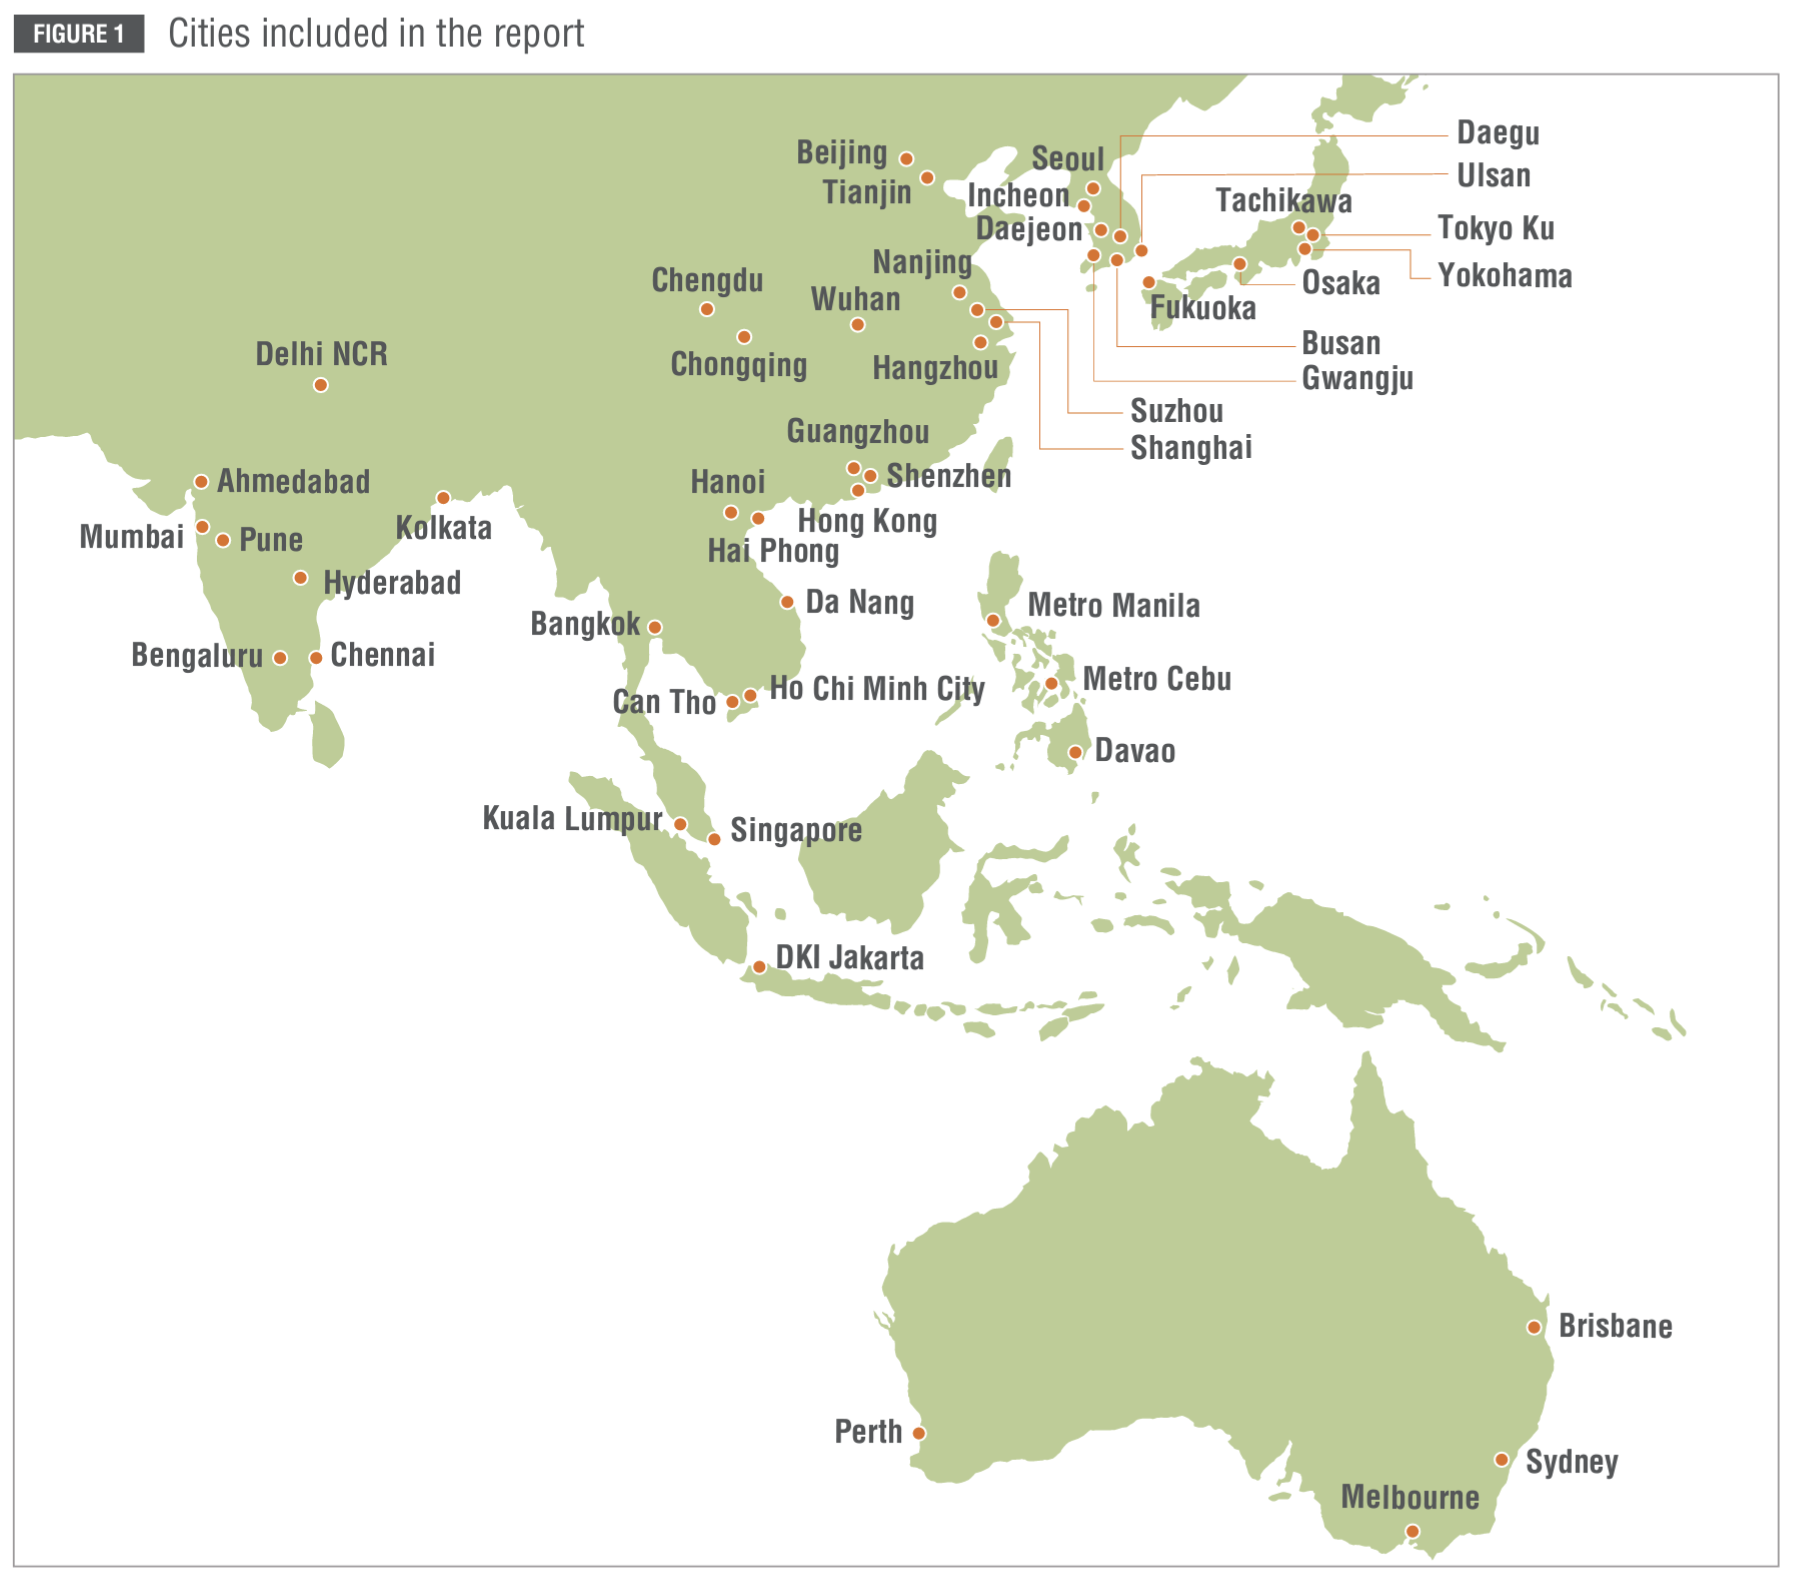
ULI is a global nonprofit research organisation founded in Washington, DC, in 1936, currently with offices in London and Hong Kong as well, and it has just released its annual Asia-Pacific Home Attainability Index report, covering 48 major cities in 11 countries in the region.
Cheap like Singapore
The report specifically focuses on the “attainability” of housing in each city, which is estimated by two simple metrics:
- Median home price to median annual household income (ideally less than 5 times)
- Median monthly rent to median monthly household income (ideally less than 30%)
Let’s just cut to the chase here, and cite the conclusion of the report verbatim:
Singapore continues to have the highest home attainability in the region with median price of Housing Development Board (HDB) units at less than 5 times median household income. Developed by the government and sold to individual Singaporeans, HDB units represent nearly 90% of the total housing stock in Singapore. Shenzhen continues to have the highest ratio of median home price relative to median annual household income at 32 times, followed by Beijing at 28 and then Metro Manila, Ho Chi Minh City, and Hong Kong SAR at around 25.
Urban Land Institute, 2024
With a ratio of 13.5, even the local private market—typically seen as expensive and inaccessible to most—doesn’t look too bad in comparison. The gap is so massive that if HDB disappeared overnight and the entire market was privatised, Singaporeans would still be nearly twice better off than Hongkongers.
Among Tier 1 cities listed in the report Singapore leads Melbourne, Kuala Lumpur and, perhaps surprisingly, Sydney.
| City | Country | Median annual income to apartment price ratio |
| Singapore (HDB) | Singapore | 4.7 |
| Melbourne | Australia | 4.9 |
| Kuala Lumpur | Malaysia | 5.5 |
| Sydney | Australia | 6.4 |
| Delhi | India | 7.5 |
| Osaka | Japan | 8.7 |
| Jakarta | Indonesia | 8.8 |
| Mumbai | India | 11.7 |
| Singapore (Private) | Singapore | 13.5 |
| Tokyo | Japan | 14.3 |
| Seoul | South Korea | 17.8 |
| Guangzhou | China | 20.4 |
| Hanoi | Vietnam | 20.8 |
| Bangkok | Thailand | 21.0 |
| Shanghai | China | 23.6 |
| Manila | Philippines | 25.0 |
| Ho Chi Minh City | Vietnam | 25.3 |
| Beijing | China | 28.6 |
| Shenzhen | China | 32.3 |
But even compared to Tier 2 locations — smaller, less populous urban areas — the city-state would come in second, marginally pipped to the post by Perth with its ratio of apartment prices to median annual income at 3.9 compared to Singapore’s HDB’s 4.7.
And, let’s not forget that Australians have no shortage of land, which naturally keeps property prices down, especially given their relatively small population.
Cities grappling with similarly limited territory and high population density — like Tokyo, Osaka, Yokohama, Seoul – are about two to three times more expensive.
Spacious like Singapore
Speaking of limited space, it doesn’t seem to be a problem for the Lion City, as the median size of HDB apartments sold is close to 100 square metres (and 112 in the private market). That is twice the average of just 50 sqm. in Hong Kong or 54 in Osaka, and considerably more than 60 to 70 sqm. in other Japanese, Chinese or Korean cities.
| City | Country | Median apartment size (sqm of usable area) |
| Hong Kong | China / SAR | 50 |
| Osaka | Japan | 54 |
| Bangkok | Thailand | 55 |
| Shenzhen | China | 58 |
| Guangzhou | China | 58 |
| Shanghai | China | 59 |
| Beijing | China | 61 |
| Tokyo | Japan | 63 |
| Yokohama | Japan | 70 |
| Seoul | South Korea | 73 |
| Incheon | South Korea | 73 |
| Busan | South Korea | 75 |
| Kuala Lumpur | Malaysia | 98 |
| Singapore (HDB) | Singapore | 98 |
| Singapore (Private) | Singapore | 112 |
| Sydney | Australia | 101 |
| Brisbane | Australia | 113 |
| Perth | Australia | 120 |
| Melbourne | Australia | 125 |
Curiously, it is only marginally behind the averages for Sydney, reporting 101 sqm. and a just bit more compared to Brisbane, Perth or Melbourne, which fall between 110 and 125, and are the largest in APAC.
Say what you will, but it does seem like a bit of a miracle that a public programme like HDB has achieved the most affordable and, at the same time, some of the most spacious apartments in the entire region, on a tiny, land-scarce island of 6 million people.