

Disclaimer: Unless otherwise stated, any opinions expressed below belong solely to the author. Data comes from the recent release of the Housing Attainability Index by Urban Land Institute.
Urban Land Institute (ULI), an international real estate non-profit research organisation founded in 1936, has just released its latest Housing Attainability Index report for Asia-Pacific, placing Singapore’s HDBs near the top in terms of housing attainability in the region—that is, affordability in proportion to local incomes—among 41 cities.
Ideally, the ratio of median home prices to the median local incomes should not exceed 5.0, though in some cities it has crossed over 20.0. Singapore is not one of them, fortunately, coming up second at 4.3, right behind Perth with a ratio of just 4.1.
This, of course, only applies to Singapore’s public HDB housing—the private market, in contrast, reports a very high rate of 16.9 (still some distance from the worst, though).
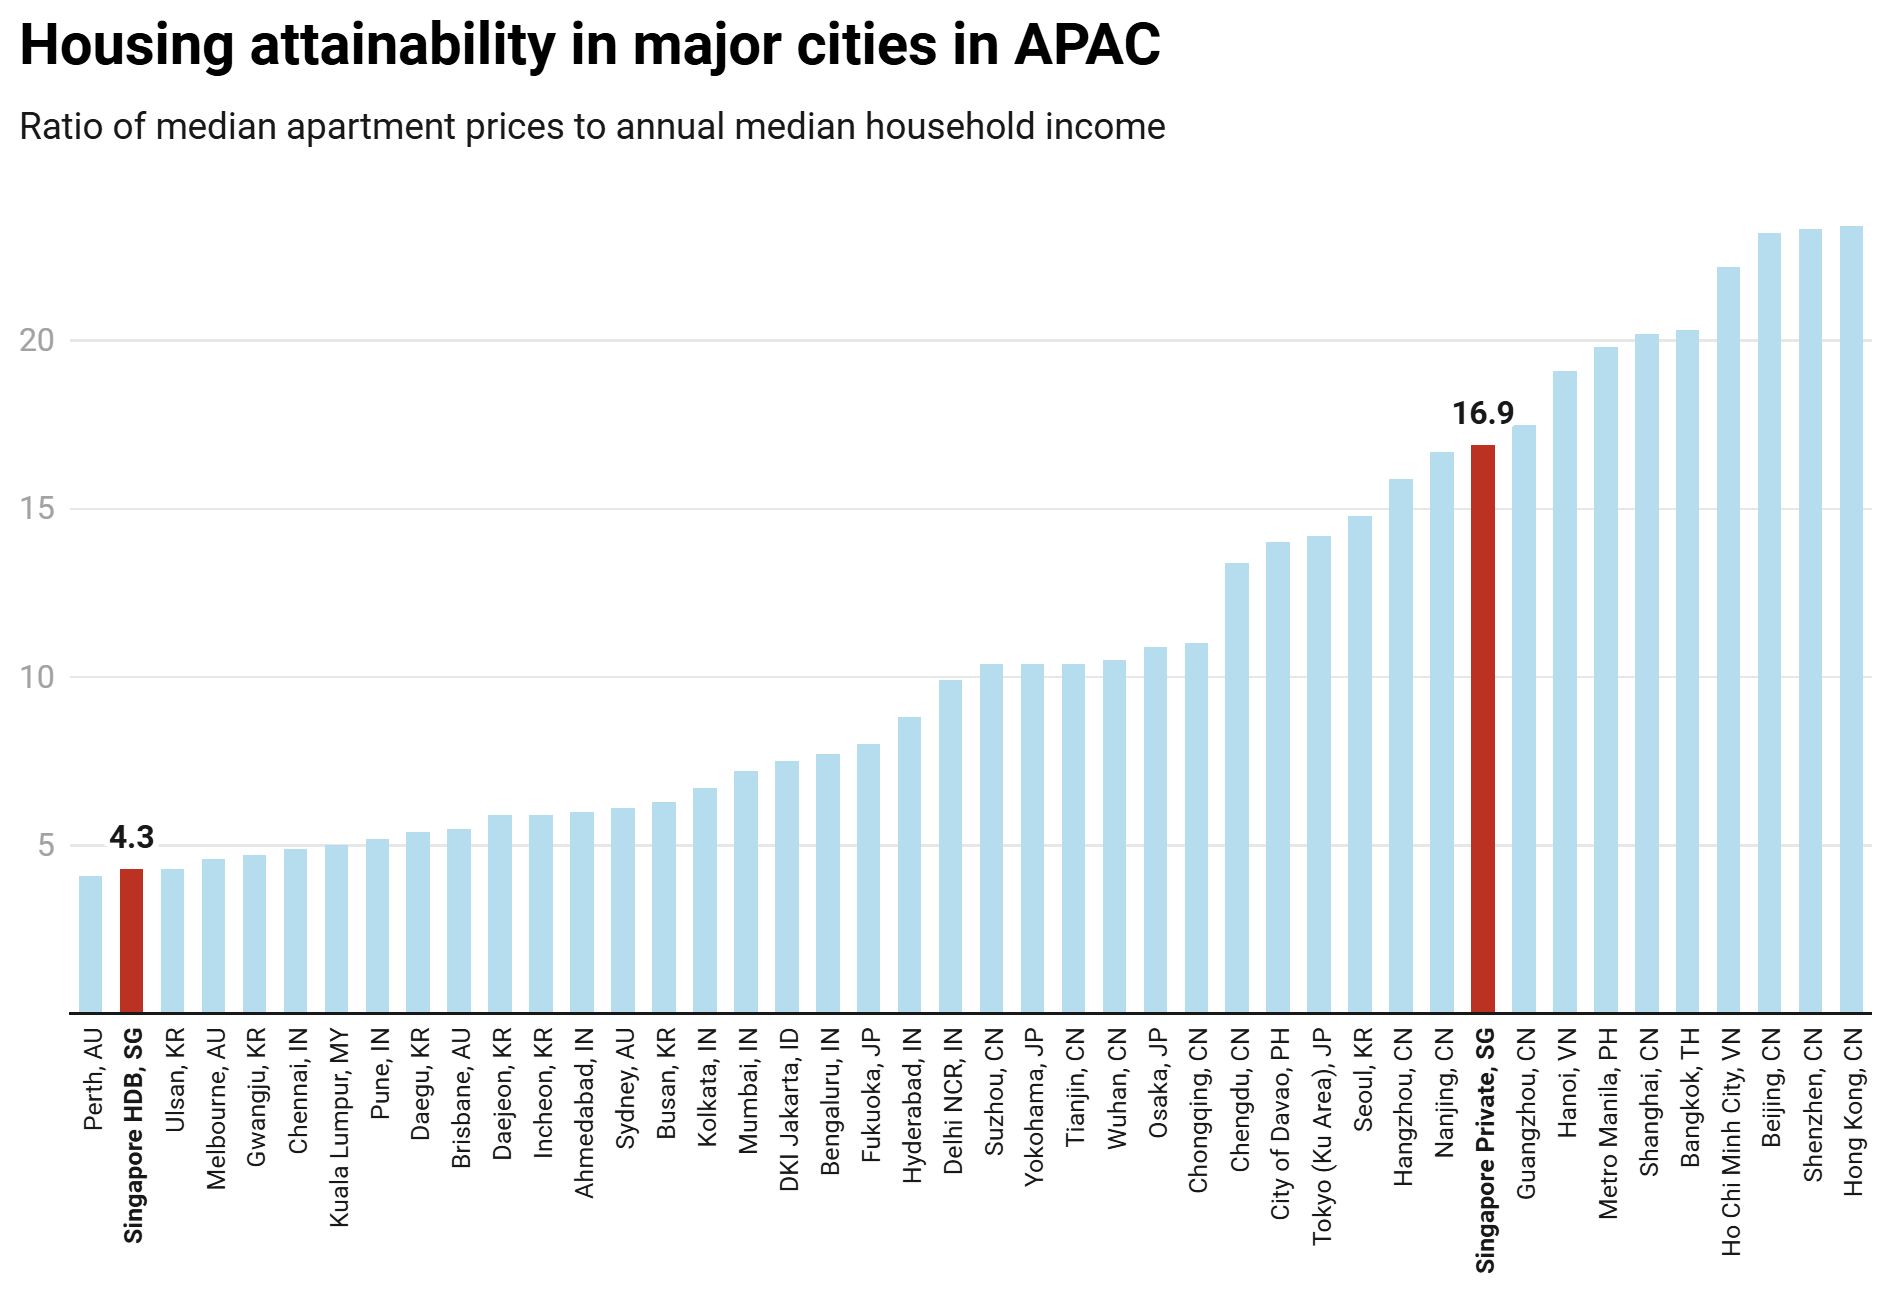
The most expensive homes, relative to local purchasing power, are largely in China, with Shanghai, Beijing, Shenzhen and Hong Kong all exceeding 20.0.
They are joined by Ho Chi Minh City in Vietnam and even Bangkok, whose condominiums cost on average 20.3 years’ worth of local household incomes, putting them beyond the reach of most Thais.
How much does your money buy, though?
Of course, transacted prices are an imperfect measure, since size preferences vary between countries and depend on available land and prevailing prices. People have a tendency to buy smaller homes in more expensive locations.
However, Singapore, again, is not one of them, with local apartments being some of the largest, coming at over 1,000 sq ft. in both the private and public markets:
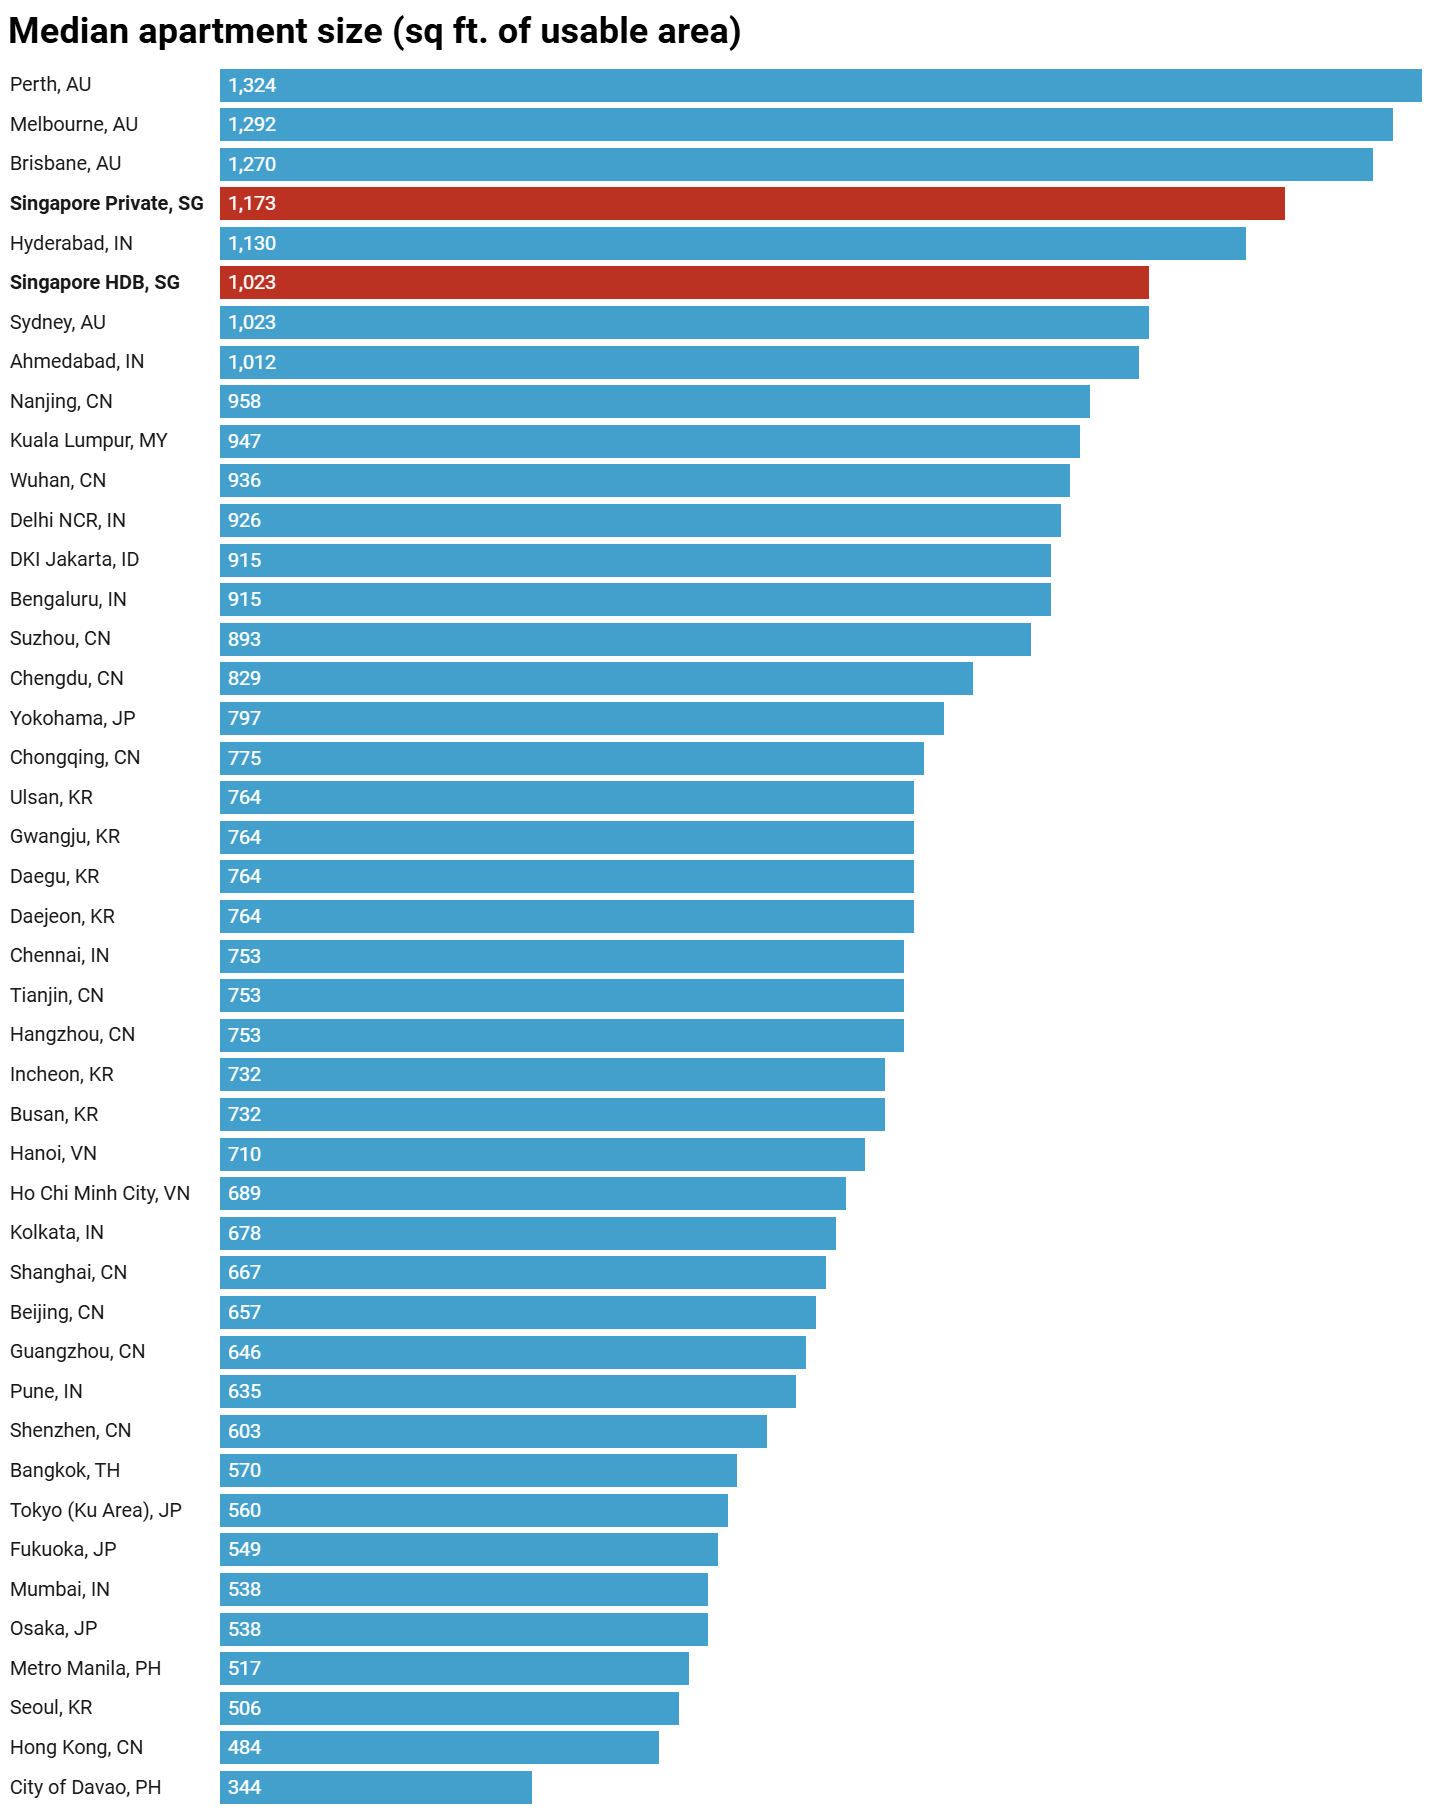
As such, it should not be a surprise, then, that in terms of relative affordability in proportion to the surface area, Singapore also ranks close to the top, this time coming in third, behind Perth and Melbourne, and ahead of Brisbane and Kuala Lumpur.
Median household income in Singapore can buy roughly 240 square feet of public housing, making it more than 10 times less expensive than housing in Hong Kong (and more than three times even for Singapore’s condominiums).
| City | Country | Square feet per median income |
| Perth | Australia | 323 |
| Melbourne | Australia | 279 |
| Singapore HDB | Singapore | 237 |
| Brisbane | Australia | 229 |
| Kuala Lumpur | Malaysia | 188 |
| Ulsan | South Korea | 179 |
| Ahmedabad | India | 168 |
| Sydney | Australia | 168 |
| Gwangju | South Korea | 161 |
| Chennai | India | 154 |
| Daegu | South Korea | 140 |
| Daejeon | South Korea | 130 |
| Hyderabad | India | 129 |
| Incheon | South Korea | 124 |
| DKI Jakarta | Indonesia | 121 |
| Pune | India | 121 |
| Bengaluru | India | 119 |
| Busan | South Korea | 116 |
| Kolkata | India | 102 |
| Delhi NCR | India | 93 |
| Wuhan | China | 90 |
| Suzhou | China | 86 |
| Yokohama | Japan | 77 |
| Mumbai | India | 74 |
| Tianjin | China | 72 |
| Chongqing | China | 70 |
| Singapore Private | Singapore | 70 |
| Fukuoka | Japan | 69 |
| Chengdu | China | 62 |
| Nanjing | China | 57 |
| Osaka | Japan | 49 |
| Hangzhou | China | 48 |
| Tokyo (Ku Area) | Japan | 39 |
| Hanoi | Vietnam | 37 |
| Guangzhou | China | 37 |
| Seoul | South Korea | 34 |
| Shanghai | China | 33 |
| Ho Chi Minh City | Vietnam | 31 |
| Beijing | China | 28 |
| Bangkok | Thailand | 28 |
| Metro Manila | Philippines | 26 |
| Shenzhen | China | 26 |
| City of Davao | Philippines | 25 |
| Hong Kong | China | 21 |
Have HDB apartments gotten expensive recently, or were they simply very cheap for too long?
Prices of public flats in Singapore remain one of the major domestic topics, following their rapid rise in recent years. In reality, however, they have simply been quite depressed for several years before the current rally.
Between 2014 and 2020, prices had remained practically flat, if not trending downwards a little bit.
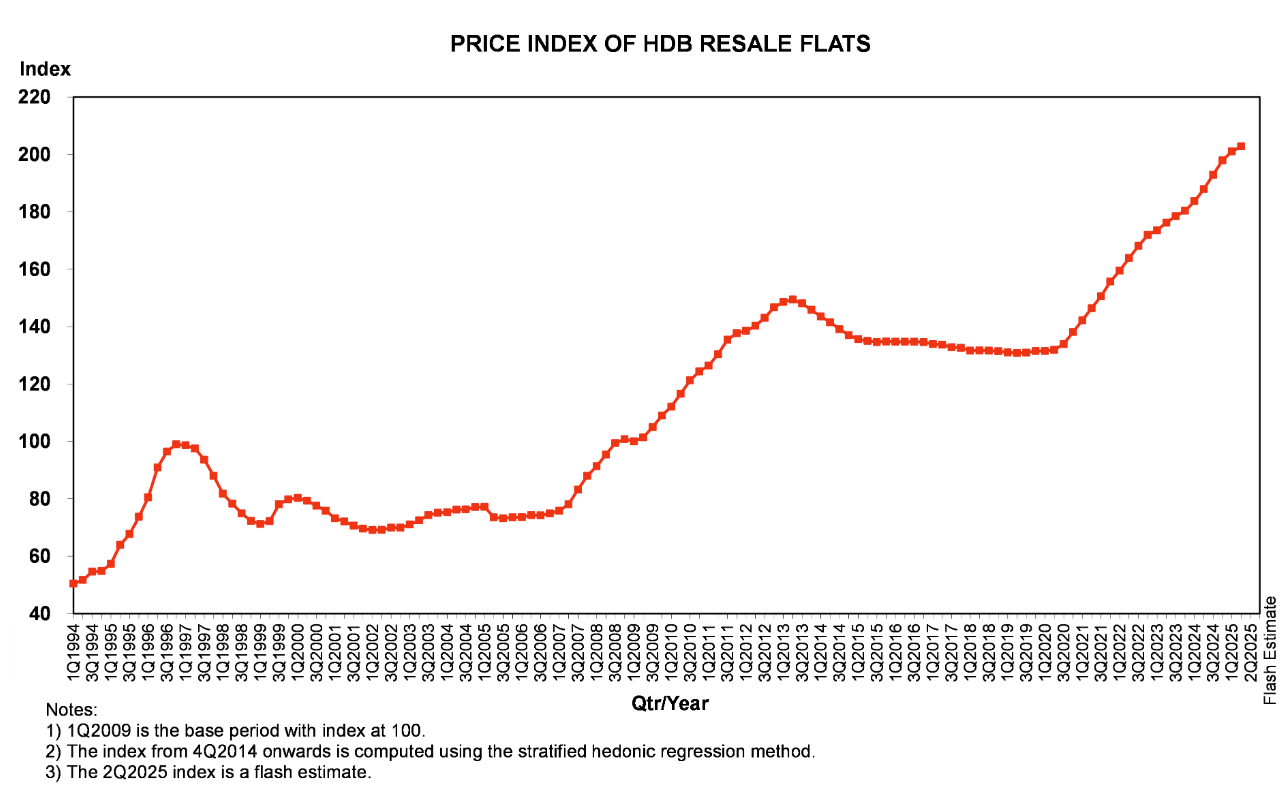
According to ULI data, as recently as 2022, the ratio between HDB prices and incomes was just 3.7. It jumped to 4.7 the following year before easing to the current 4.3.
In percentage terms, resale HDB prices have gone up quite quickly by a noticeable amount, but if we consider the long-term price and income developments, they remain affordable, particularly for a developed city of Singapore’s size.
In fact, when compared to national capitals across Asia-Pacific, there’s no other that comes close. Data proves that grass really isn’t greener on the other side.
- Read other articles we’ve written on Singapore’s current affairs here.
Featured Image Credit: Trun Tran/ Unsplash