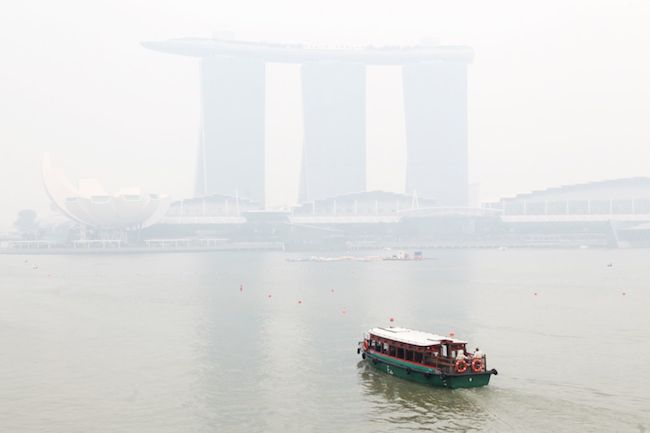
In a Facebook post Tuesday night, Singapore Environment and Water Resources Minister Vivian Balakrishnan shared that Singapore is facing an early and prolonged bout of haze.
“Again. Hot spots increasing dramatically in Sumatra, with 458 visible today. Haze may worsen when the winds weaken next week. Some rain expected, but not enough to douse the fires. We will try to encourage them to take action — but we all know the welfare of close neighbours is not their priority. Hard truths of regional politics,” he wrote.

According to the National Environment Agency (NEA) website, there were 458 hot spots detected on Tuesday, with 246 in the Riau province. This was more than double the 187 detected on Monday.
Although the likelihood of transboundary haze affecting Singapore this week remains low because prevailing northeasterly winds are expected to remain for these two weeks, NEA said Singapore may experience “occasional slight haze due to the accumulation of particulate matter under stable atmospheric conditions”.
As at 9pm on Tuesday, Singapore’s three-hour Pollutant Standards Index (PSI) reading was 38 — within the “good” air quality range.
Singapore experienced its worst bout of haze in June last year, with the PSI hitting a record high of 401 at one point.
Taking a lesson from the haze last year, it would not be a surprise to see some people stocking up on the N95 mask. There are also several other apps and websites which allows you to monitor the PSI level in Singapore.
1. The National Environment Agency

2. SG PSI – Singapore’s Haze, is a free Android app developed by a team consisting of Singaporeans, Vietnamese and Indonesians. The app draws information from NEA’s website and changes the background color to reflect the danger level of the haze.
There are three color codes – green, yellow and red. If the background color is yellow or red, users are advised to stay indoors. The developers deliberately placed a big font for the PSI reading for easy viewing. You can download the app here.

3. PSI Chart; Developed by Aung Myint Thein and Soe Thet Aung, PSI Chart lays out the 3-hour average PSI Reading from data by NEA.

If any of the readings on these charts go through the roof, you know it is time to stock up on those N95 masks.
Also read: Cases of H1N1 detected in Malaysia, Singapore, Thailand and Vietnam