
When it comes to investing, many traders see gold as a reliable choice. This precious metal has been used as a form of currency and store of value for centuries, earning it a reputation as a reliable asset. Its inherent value and limited supply also make it a popular choice for those looking to hedge against inflation or economic uncertainty. As such, gold trading has become a staple of many investment portfolios, with traders keeping a close eye on this valuable commodity’s price movements and fluctuations.
Investors have two main options when it comes to gold trade: they can buy physical gold or invest in gold ETFs, or they can trade derivatives such as futures and options that are linked to the price of gold. Alternatively, traders can take advantage of the fluctuations in the commodity trading market by trading derivatives linked to gold, such as futures, CFDs, options, and other financial instruments.
Common Factors that Move Gold
Before we get deep into the technical analysis, let’s observe some common factors that move gold.
Various factors influence the price of gold. One of the most significant factors is economical and political uncertainty. Gold is considered a safe-haven asset that people often use to hedge against inflation during times of instability. Another factor is the demand for gold in various industries, such as jewelry, technology, and investments, contributing to the market’s stability. Additionally, the discovery of new gold deposits affects the supply and demand of gold, thereby affecting its price. Furthermore, as gold is priced in US dollars, fluctuations in the US dollar’s value also impact gold’s attractiveness to investors.
Support and Resistance Lines
Support levels are price levels where the price of gold has bounced off and reversed its downward trend, while resistance levels are those where the price of gold has previously struggled to break through and continue its upward trend.
To trade gold using support and resistance lines, you can follow these steps:
- Identify the support and resistance levels on the gold price chart. To identify these levels, you can use technical analysis tools like moving averages, trend lines, and chart patterns.
- Once you have identified the support and resistance levels, you can start looking for trading opportunities. When the price of gold approaches a support level, you can look to buy gold, as the price is likely to bounce off and reverse its downward trend. On the other hand, when the price of gold approaches a resistance level, you can look to sell gold as the price is likely to struggle to break through and continue its upward trend.
- To manage your risk, you can set stop-loss orders below the support level if you’re buying gold or above the resistance level if you’re selling gold. This will help you limit your potential losses if the price of gold breaks through the support or resistance level.
- You can take profits by selling gold near the resistance level if you’re buying gold or buying gold near the support level if you’re selling gold.
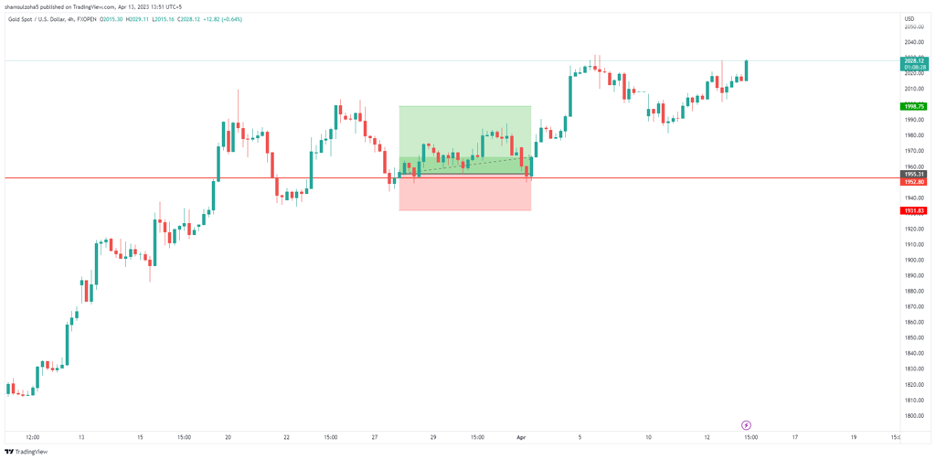
Image 1. The red line is a potential support level on the 4-hour chart at gold. The market bounces off the support line, providing an opportunity for a long trade. As mentioned above, the stop loss is placed just beneath the line with take profit on the next resistance.
RSI and Moving Averages
Use a charting platform to plot the gold price chart and add the RSI and moving average indicators. The moving averages commonly used are the 50-day and 200-day moving averages.
- Look for potential buy or sell signals by examining the relationship between the RSI and the moving averages. When the RSI crosses above the 50-day moving average, it can indicate a buy signal, while when it crosses below the 50-day moving average, it can indicate a sell signal. Similarly, when the RSI crosses above the 200-day moving average, it can indicate a strong buy signal. In contrast, when it crosses below the 200-day moving average, it can indicate a strong sell signal.
- Use the RSI to confirm the signals generated by the moving averages. For example, suppose the RSI is above 50 and rising. In that case, it can establish a buy signal generated by the crossover of the 50-day moving average above the 200-day moving average.
- Use the moving averages to set your stop-loss orders. Place stop-loss orders below the 50-day moving average if you’re buying gold or above the 50-day moving average if you’re selling gold.
- Take profits by closing your position when the RSI reaches the overbought or oversold level. For example, you can sell gold when the RSI comes above 70 or buy gold when the RSI goes below 30.
Remember, trading gold using RSI and moving averages requires practice and patience. Doing your own research and analysis before making any trading decisions is important.
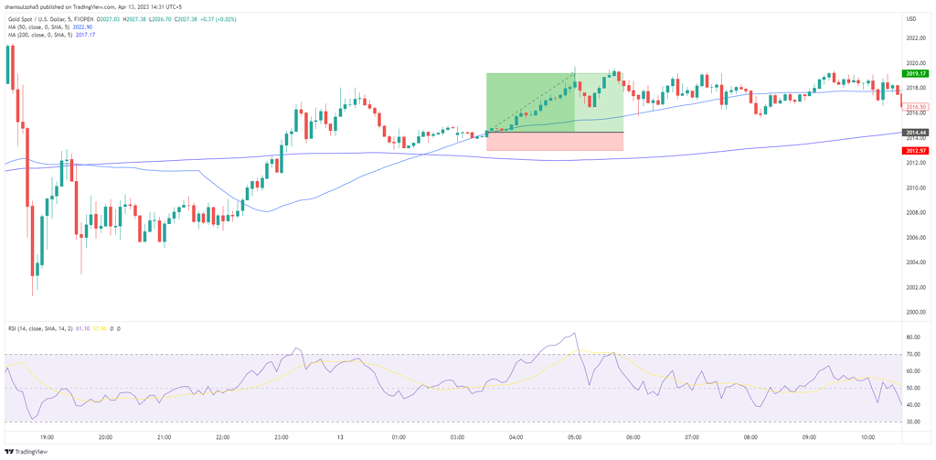
Image 2. The moving average cross-over coupled with RSI hovering over 50 provides good confluence on a long trade at gold. The stop loss is placed just below the 50 MA. The position is closed as the RSI reaches overbought conditions.