Disclaimer: Unless otherwise stated, any opinions expressed below belong solely to the author. Data sourced from the Ministry of Manpower and Singapore Department of Statistics.
While Singapore hasn’t been affected by inflation nearly as badly as most other countries, there’s no denying the fact that prices have gone up quite a lot since pre-pandemic levels. Cumulative inflation over the past five years has added 16.4% to the cost of consumer products across the board.
To offset this and keep the value of people’s incomes at least at the same level, salaries should have gone up by at least as much.
But I often hear complaints that they have either stagnated or are failing to follow the prices. Could those be just complainers who pick the wrong products? Or maybe they’re just weak workers, lagging behind the rest? After all, individual situations are different from the statistical average—some are making more, some are making less.
However, there is evidence in the data to suggest that it is a broader phenomenon, affecting certain industries in the past few years. And while there aren’t many of them, it’s certainly enough to be noticeable.
Most Singaporeans are better off than in 2019
The median monthly income from work across the entire economy has gone up by over 20% since 2019—netting a 3.6% gain in real growth.
This means that even at the inflated prices of goods and services, Singaporeans can afford to buy 3.6% more of them than they did in 2019.
However, not all of them can.
While there is not a single industry where incomes are nominally lower today than they were five years ago (although there are some when we look at the breakdown by gender), there are at least four industries where Singaporeans earn less than they did in 2019, when corrected for inflation.
These are Community, Social & Personal Services and, somewhat surprisingly, I’m sure, Real Estate Services and Public Administration & Education (as well as Other services that are not listed, which may include agriculture, fishing, utilities and so on).
Three more barely make it above the 2019 levels, that is Manufacturing, Administrative & Support Services, as well as Arts, Entertainment & Recreation.
The leaders are, again somewhat surprisingly, Accommodation & Food Services—albeit this is a jump from very low levels, and still under S$3000—and, this time unsurprisingly, the usual front runners in finance and IT.
Median gross monthly income from employment by industry
Full-time employed residents/ including employer CPF
| Industry | 2019 | 2024 | Nominal salary change | Real salary change |
| OVERALL | S$4,563 | S$5,500 | +20.5% | +3.6% |
| Accommodation & Food Services | S$2,300 | S$2,974 | +29.3% | +11.1% |
| Financial & Insurance Services | S$6,913 | S$8,736 | +26.4% | +8.6% |
| Information and Communications | S$6,047 | S$7,605 | +25.8% | +8.1% |
| Wholesale & Retail Trade | S$4,118 | S$5,070 | +23.1% | +5.8% |
| Professional Services | S$5,704 | S$6,900 | +21.0% | +4.0% |
| Transportation & Storage | S$3,225 | S$3,900 | +20.9% | +3.9% |
| Health & Social Services | S$4,199 | S$5,070 | +20.7% | +3.8% |
| Construction | S$4,095 | S$4,914 | +20.0% | +3.1% |
| Arts, Entertainment & Recreation | S$4,056 | S$4,777 | +17.8% | +1.2% |
| Administrative and Support Services | S$2,808 | S$3,296 | +17.4% | +0.9% |
| Manufacturing | S$5,000 | S$5,850 | +17.0% | +0.6% |
| * Other | S$5,070 | S$5,786 | +14.1% | -1.9% |
| Public Administration & Education | S$6,338 | S$7,032 | +10.9% | -4.6% |
| Real Estate Services | S$4,520 | S$4,908 | +8.6% | -6.7% |
| Other Community, Social & Personal Services | S$3,250 | S$3,510 | +8.0% | -7.2% |
Looking at the breakdown by gender reveals more intriguing insights. It turns out that men working in Community, Social & Personal Services receive less than what they did in 2019.
The same is observed for women in Real Estate, usually considered highly lucrative, especially amid the rising property prices in recent years—though it is likely more than made up for in commissions, which presumably do not count under “employment income.”
It’s interesting that the base figures have gone down over time, cutting away around 1/6th of the salary in real terms.
Male
| Industry | 2019 | 2024 | Nominal salary change | Real salary change |
| OVERALL | S$4,810 | S$5,850 | +21.6% | +4.5% |
| Accommodation & Food Services | S$2,571 | S$3,276 | +27.4% | +9.5% |
| Arts, Entertainment & Recreation | S$4,056 | S$5,070 | +25.0% | +7.4% |
| Health & Social Services | S$5,265 | S$6,500 | +23.5% | +6.1% |
| Wholesale & Retail Trade | S$4,563 | S$5,593 | +22.6% | +5.3% |
| Financial & Insurance Services | S$8,009 | S$9,787 | +22.2% | +5.0% |
| Construction | S$4,278 | S$5,175 | +21.0% | +4.0% |
| Transportation & Storage | S$3,000 | S$3,624 | +20.8% | +3.8% |
| Information and Communications | S$6,782 | S$8,190 | +20.8% | +3.8% |
| Administrative and Support Services | S$2,700 | S$3,218 | +19.2% | +2.4% |
| Professional Services | S$6,338 | S$7,430 | +17.2% | +0.7% |
| Manufacturing | S$5,460 | S$6,338 | +16.1% | -0.2% |
| Real Estate Services | S$4,500 | S$5,000 | +11.1% | -4.5% |
| * Other | S$5,290 | S$5,850 | +10.6% | -5.0% |
| Public Administration & Education | S$6,954 | S$7,605 | +9.4% | -6.0% |
| Other Community, Social & Personal Services | S$3,494 | S$3,425 | -2.0% | -15.8% |
Female
| Industry | 2019 | 2024 | Nominal salary change | Real salary change |
| OVERALL | S$4,329 | S$5,265 | +21.6% | +4.5% |
| Accommodation & Food Services | S$2,106 | S$2,699 | +28.2% | +10.1% |
| Financial & Insurance Services | S$6,338 | S$8,086 | +27.6% | +9.6% |
| Wholesale & Retail Trade | S$3,686 | S$4,680 | +27.0% | +9.1% |
| Professional Services | S$5,070 | S$6,338 | +25.0% | +7.4% |
| * Other | S$4,388 | S$5,460 | +24.4% | +6.9% |
| Information and Communications | S$5,489 | S$6,825 | +24.3% | +6.9% |
| Health & Social Services | S$3,949 | S$4,852 | +22.9% | +5.6% |
| Construction | S$3,549 | S$4,323 | +21.8% | +4.7% |
| Administrative and Support Services | S$2,925 | S$3,560 | +21.7% | +4.6% |
| Manufacturing | S$4,129 | S$4,961 | +20.2% | +3.3% |
| Transportation & Storage | S$3,949 | S$4,680 | +18.5% | +1.8% |
| Arts, Entertainment & Recreation | S$4,058 | S$4,631 | +14.1% | -1.9% |
| Public Administration & Education | S$5,704 | S$6,500 | +14.0% | -2.1% |
| Other Community, Social & Personal Services | S$3,168 | S$3,510 | +10.8% | -4.8% |
| Real Estate Services | S$4,586 | S$4,446 | -3.1% | -16.7% |
Many Singaporeans are playing catch-up
With seven out of 15 listed industries either providing negative or barely positive salary change over the past five years, it is easy to understand why many Singaporeans have a different view of the economic situation which, on average, looks to be positive.
While most appear to be better off than before the pandemic, those feeling left behind are not a tiny minority.
Of course, ultimately, we are all in charge of our lives and these are just median figures—meaning that many Singaporeans in each sector take home more than the listed amounts. But equally many take less, and their dissatisfaction may not always be baseless.
- Read other articles we’ve written on Singapore’s current affairs here.
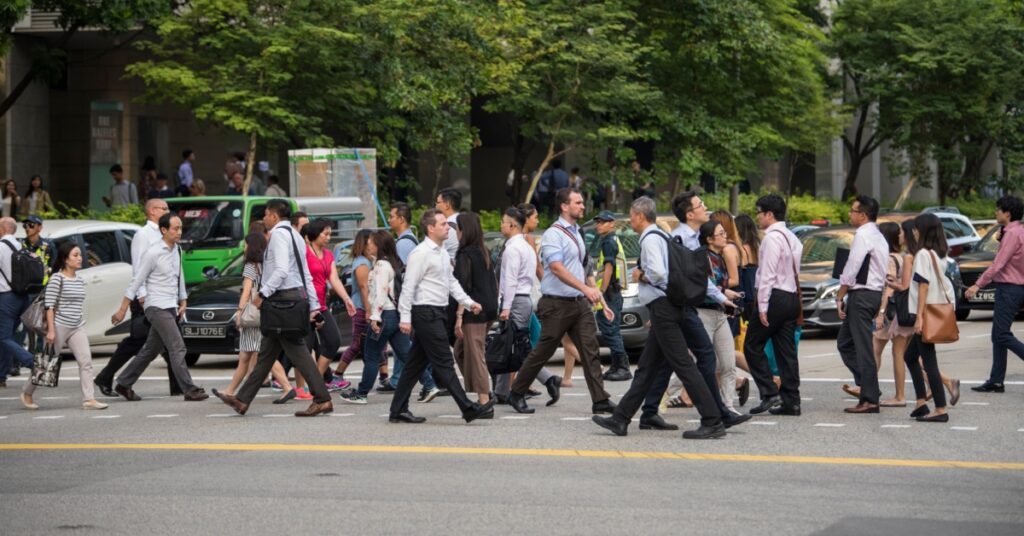
Featured Image Credit: Shutterstock.com